| Basic display Just left Click somewhere in image Change the time limits and Click again One can zoom with the wheel or slider at the bottom | 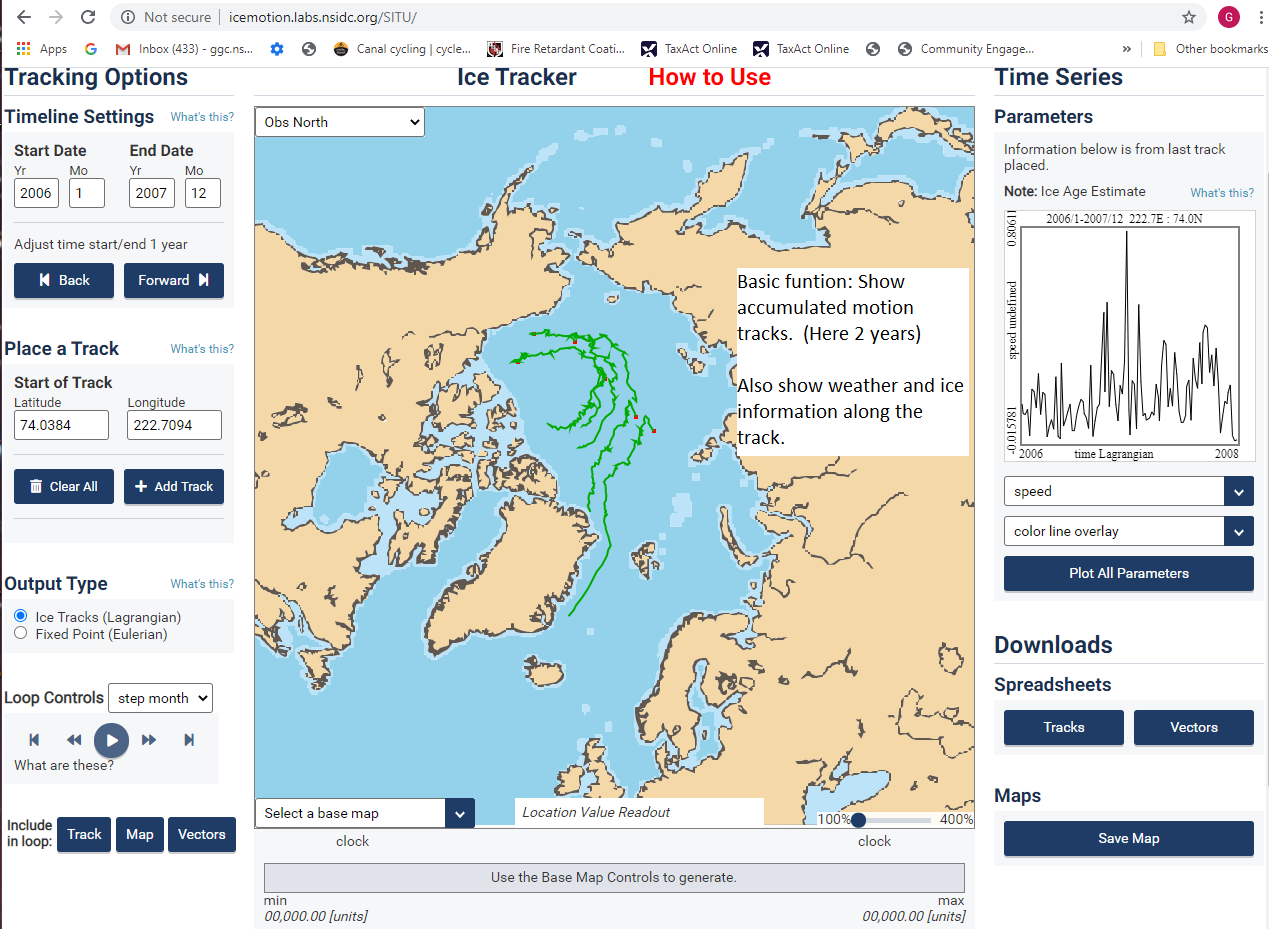 |
Weather display Press Plot all Parameters You can download the data as well |  |
| Many tracks using forward/back Set time to one year Click a point or add track Press Forward/Back to see track at new starting time | 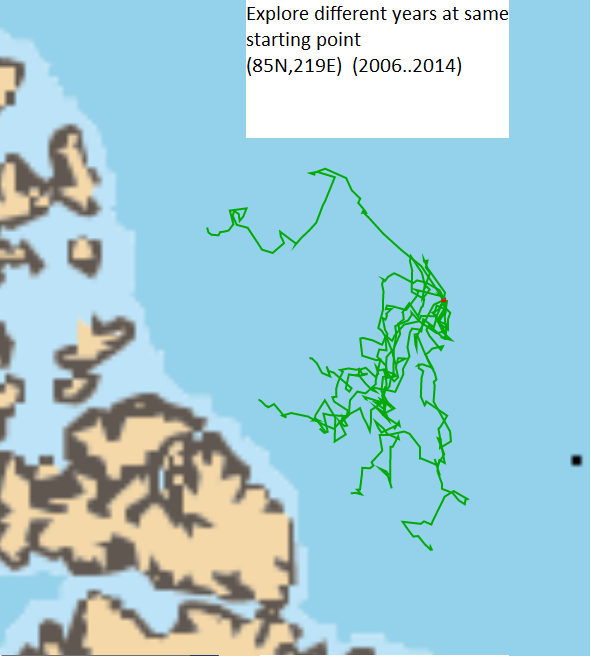 |
Select Model source Use pull down (upper left) to change data source/td> | 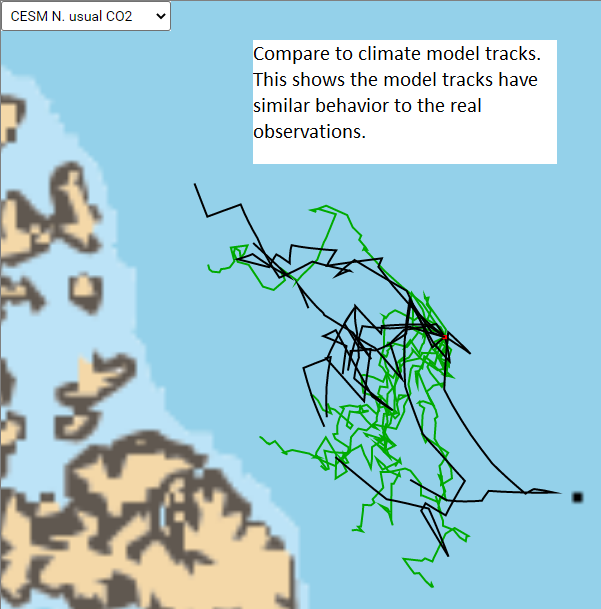 |
| Long time series Click Euler then Click map Click the small time series plot (TS) to get long plots/td> | 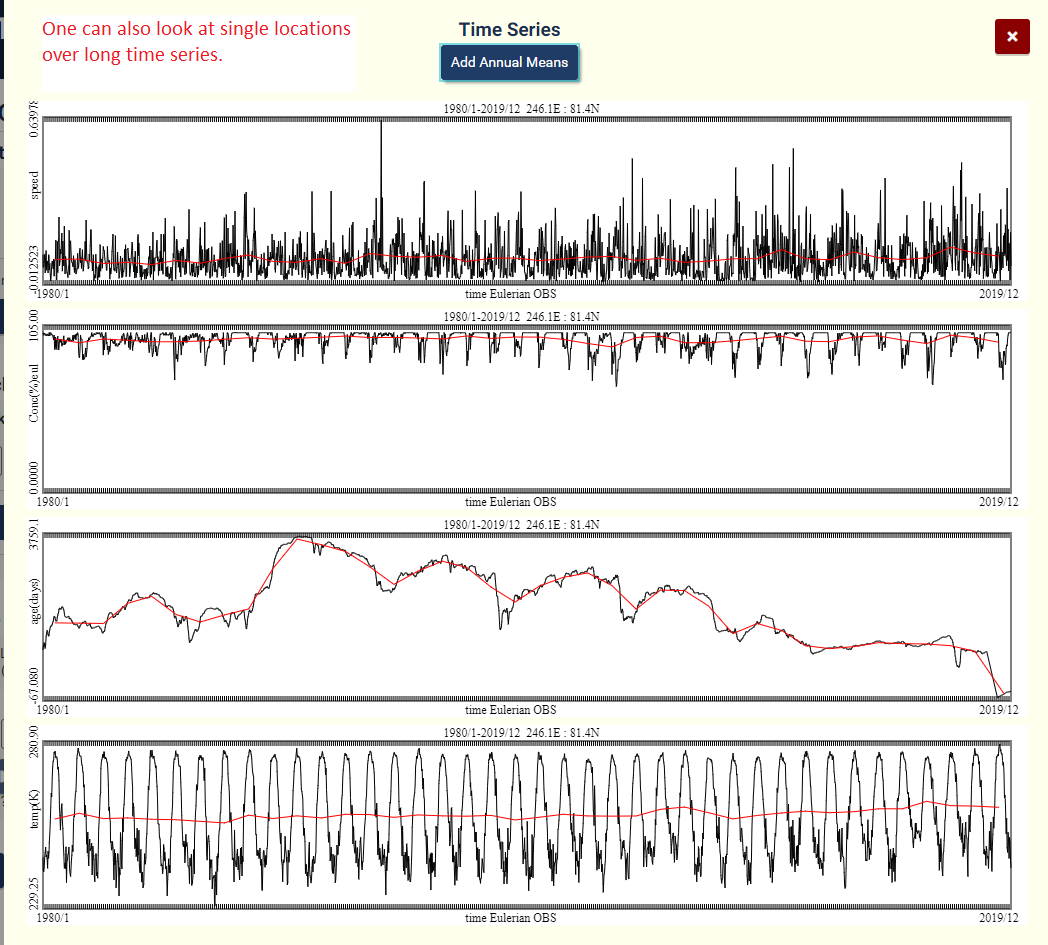 |
Model time series Select data source Click map Click Euler Click TS plot | 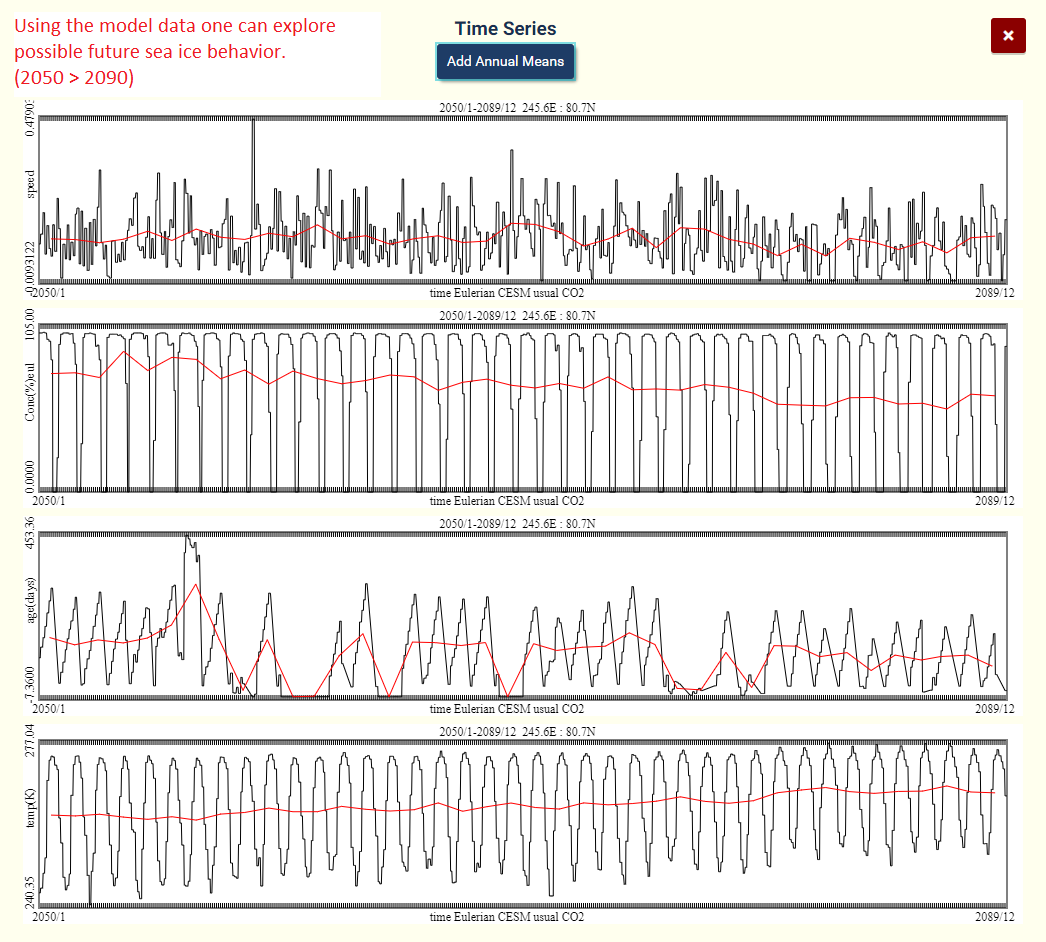 |
| Add maps Pull down lower right To make animation, select map and press play |  |
South accessed from source pull down(select source) The click away and zoom | 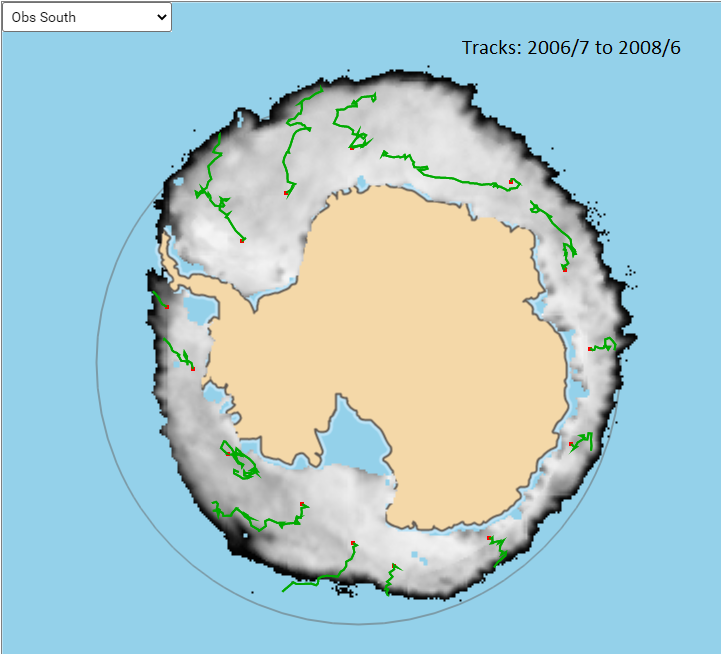 |